Update Date: April - 2024
Carlos Alegria, Yuri Nunes
Go to paper pre-print (Research Gate) Paper Link
Navigation to related reports:
US - Death Trends from Neoplasms, Ages 15-44
US - Death Trends from Neoplasms for all ages and detailed analysis of 75-84
In this work we provide an estimate of the degree of over-reporting of COVID-19 as the underlying cause of death in the US. We calculate the over-reporting adjustment factor by comparing the ratios of reporting of COVID-19 as multiple cause of death to underlying cause of death, with the equivalent ratio for Influenza and Pneumonia (ICD-10 codes J09-J18).
Our results show that there is a systematic over-reporting of COVID-19 when reported as underlying cause of death, when compared to Influenza and Pneumonia during the same period. The average over-reporting factor is about 2.5 to 3 for all ages. We also observe that for ages 15 to 54 the over-reporting factor ranged from 2 to 3.5 between 2020 and 2022, which is higher than for younger and older individuals. For older individuals, the over-reporting factor ranged from 1.9 to 3, while for younger individuals the over-reporting factor ranged from 1.1 to 2.8.
The over-reporting factors we compute only account for the relative over-reporting of COVID-19 as the underlying cause of disease as opposed to as a contributing cause, when compared with influenza and pneumonia. This work therefore contributes to the ongoing discussion of death “with” COVID-19 versus “from” COVID-19.
Country: US
Period: Yearly data from 2010 to 2022.
Cause of Death Data
The data used in this analysis are the number of deaths that occurred in the USA between 2010 and 2022, by underlying cause code (ICD-10), sex, and 10-year age groups, obtained using the CDC WONDER system provided by the National Center for Health Statistics of the Centers for Disease Control and Prevention (CDC). The mortality data is final up to 2021 but provisional from 2022 onwards.
Additionally, for comparing multiple cause (MC) of death trends from Influenza & Pneumonia and COVID-19 with underlying cause (UC) of death trends, we downloaded data from both the multiple cause of death databases and underlying cause of death databases.
Link to the underlying cause of death databases: CDC Wonder Underlying Cause of Death Data
Link to the multiple cause of death databases: CDC Wonder Multiple Cause of Death Data
Limitations on CDC Data Utilization:
In this research paper we abide by the CDC’s restrictions on data use which are:
In alignment to the guidelines set forth by the Centers for Disease Control and Prevention (CDC) regarding data utilization, this research paper complies with the following restrictions:
“The Public Health Service Act (42 U.S.C. 242m(d)) provides that the data collected by the National Center for Health Statistics (NCHS) may be used only for the purpose for which they were obtained; any effort to determine the identity of any reported cases, or to use the information for any purpose other than for health statistical reporting and analysis, is against the law. Therefore, users will:
In this section we perform a yearly analysis of the death rates for individuals aged 35 to 44 in the USA, using the data from CDC WONDER. We first compute the ratio of MC/UC deaths for both COVID-19 and Influenza & Pneumonia and then calculate the respective adjustment factors which are applied to the UC COVID-19 death rates. The analysis of the 35 to 44 age group is a case study that is then generalised to the whole population further below.
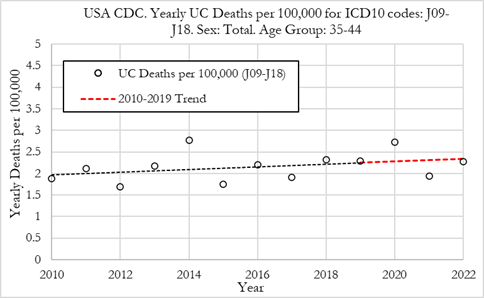
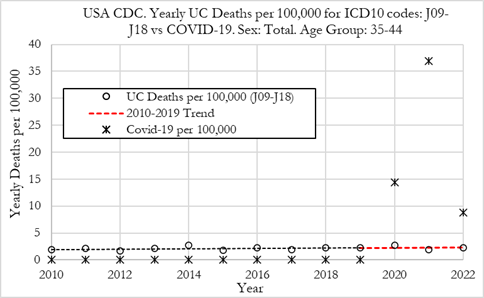
We plot the death rates from Influenza & Pneumonia (J09-J18) and COVID-19 (U07.1 code) from 2010 to 2022 where these diseases were the underlying cause of death, as recorded on the death certificate (Figure below). The death rates are computed as the number of deaths for a given year divided by the population cohort for the 35-44 age group. The death rates are shown as deaths per 100,000 population.
In the left Figure we can observe that the UC death rates from Influenza & Pneumonia were very stable from 2010 to 2022, with a slight upward trend. The death rate was 1.88 per 100,000 in 2010 and 2.28 per 100,000 in 2022. In 2020, the death rate from influenza and pneumonia was slightly above trend, at a value of 2.72 per 100,000 and in 2021 and 2022 the death rate was close to the 2010-2019 trendline.
From the right Figure we can observe that the UC death rates from COVID-19 in 35 to 44 year-olds were much higher than for Influenza & Pneumonia in 2020 and 2021. In 2020 the COVID-19 death rate was 14.4 per 100,000, double the rate for Influenza & Pneumonia, and in 2021 it was 36.9 per 100,000, around 19 times higher than Influenza & Pneumonia. In 2022, with the milder Omicron variant in circulation and the rollout of the COVID-19 vaccinations, the UC death rate from COVID-19 dropped to its lowest level since the start of the pandemic, but was still 8.9 per 100,000 (3.9 times higher than death rates from Influenza and Pneumonia).
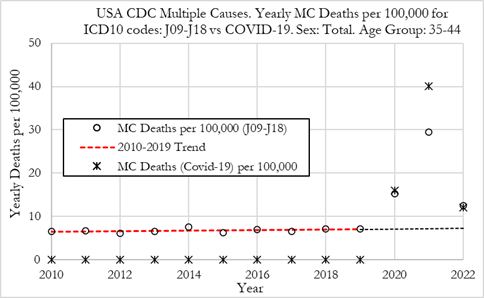
In this section, we plot the death rates from Influenza & Pneumonia (J09-J18) and COVID-19 (U07.1 code) from 2010 to 2022 where these diseases were among the multiple cause of death (MC) i.e. recorded on the death certificate either as underlying cause or a contributing cause of death (Figure below). The death rates are computed as the number of deaths for a given year divided by the population cohort for the 35-44 age group. The death rates are shown as MC deaths per 100,000 population.
In the left Figure we can observe that the MC death rates from Influenza & Pneumonia were very stable from 2010 to 2019, with a slight upward trend. The death rate was 6.6 per 100,000 in 2010 and 7.2 per 100,000 in 2019. In 2020, the MC death rate from Influenza & Pneumonia rose substantially, to a value of 15.2 per 100,000 and in 2021, and to 29.4 per 100,000. In 2022 the death rate from Influenza & Pneumonia was 12.6 per 100,000.
We can also observe that the MC death rate from COVID-19 was higher than for Influenza & Pneumonia in 2020 and 2021, but slightly lower in 2022. In 2020 the COVID-19 MC death rate was 16.0 per 100,000 in 2020, 40.1 per 100,000 in 2021, and 12.0 per 100,000 in 2022.
In 2020, 2021 and 2022, MC death rates from Influenza & Pneumonia were of similar magnitude to those for COVID-19 which is the opposite of our previous findings when comparing UC death rates. However, the increase in MC Influenza & Pneumonia during the pandemic is likely explained by people with another respiratory illness, for viral or bacterial pneumonia, dying from COVID-19 as the underlying cause.
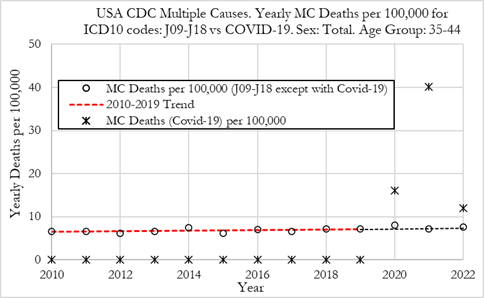
Consequently, a fair comparison of MC Influenza & Pneumonia death rates with MC COVID-19 death rates should be done by removing all deaths where both Influenza & Pneumonia and COVID-19 appeared in the death certificates. This is done in the right Figure that compares MC death rates from Influenza & Pneumonia except where COVID-19 also appeared in the death certificates, with MC COVID-19 death rates.
After performing the adjustment, we can observe that MC death rates from Influenza & Pneumonia do not deviate from the 2010-2019 trend. We also notice that MC death rates from COVID-19 in 2020 and 2021 were substantially higher than MC death rates for Influenza & Pneumonia. In 2022 however, after the adjustment, even though MC death rates from COVID-19 were still higher than MC death rates from Influenza & Pneumonia, they were of comparable magnitude.
In this section, we compute the ratio of R*=MC*/UC death rates from Influenza & Pneumonia (J09-J18) and compare them with the equivalent ratio for COVID-19 (U07.1 code), from 2010 to 2022 (see Figure 3). The ratio R*=MC*/UC death rates for Influenza & Pneumonia was computed using the adjusted MC* death rates, which is the MC death rates from Influenza & Pneumonia except where COVID-19 is mentioned in the death certificate.
The results in the Figure below show that the ratio of MC*/UC death rates for Influenza & Pneumonia (J09-J18) are stable both before the pandemic years, from 2010 to 2019, and also during 2020, 2021 and 2022, within the range of 2.5 to 4. The 2010 to 2015 average was about 3.3. These values mean that deaths from Influenza & Pneumonia as the underlying cause of death were 30.3% of those that appeared as multiple causes (which includes those recorded as underlying cause).
For COVID-19 deaths, the Figure below shows that the ratio of MC/UC death rates was 1.11 in 2020, 1.09 in 2021, and 1.36 in 2022. These values mean that about 90% of deaths from COVID-19 were registered as the underlying cause of death on the death certificate in 2020 and 2021. In 2022, even though a higher proportion of deaths relating to COVID-19 were classified with COVID-19 as a secondary cause of death, 73% of COVID-19 deaths still had COVID-19 classified as being the underlying cause.
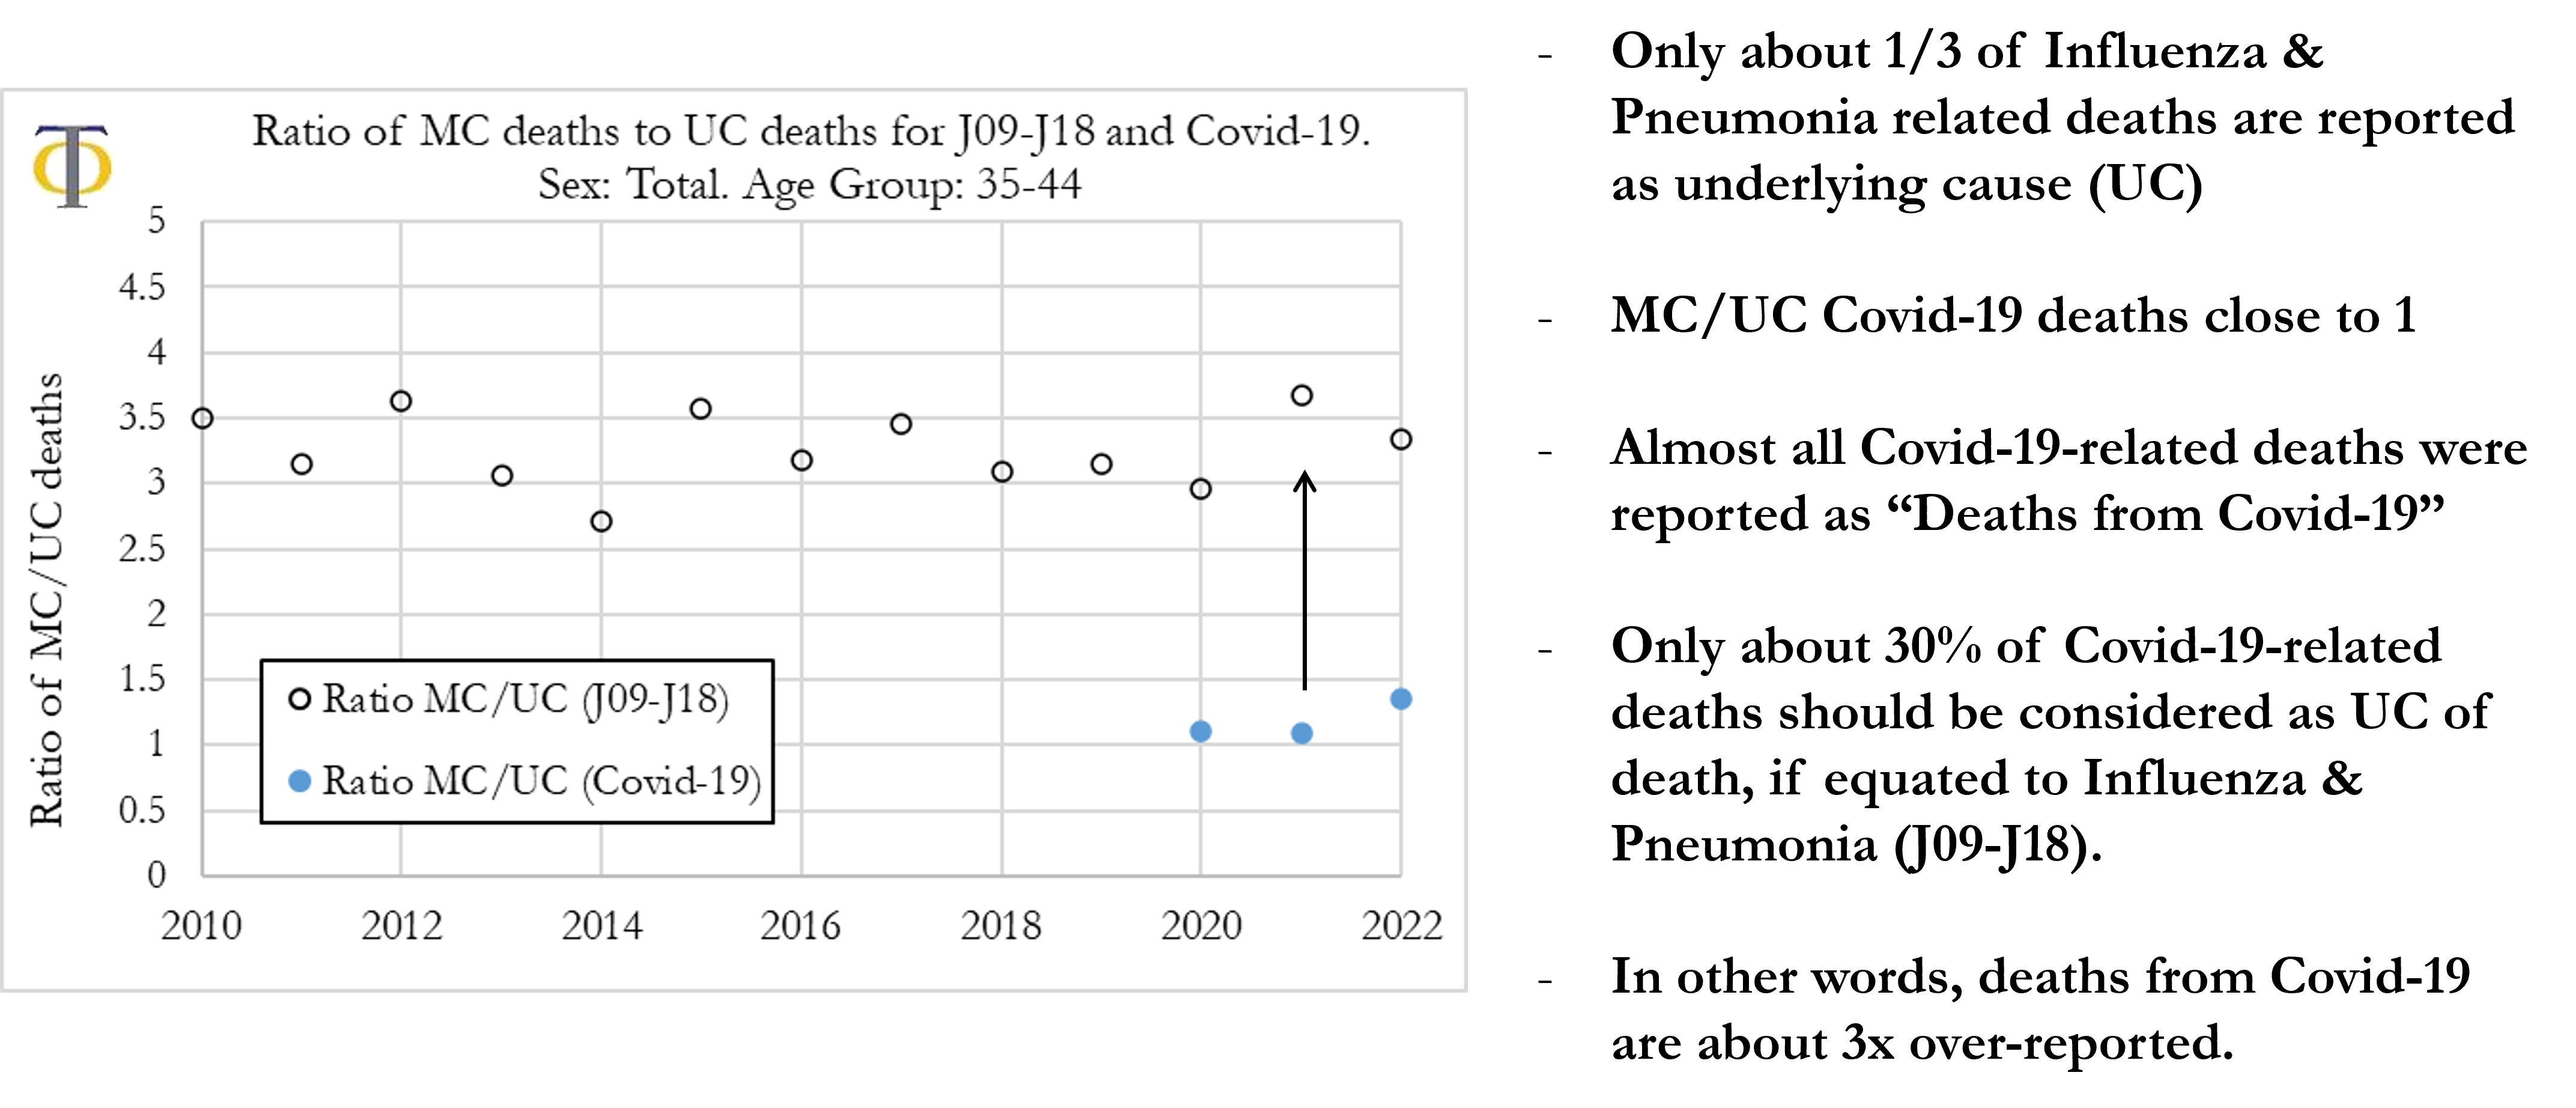
As previously mentioned, a possible criterion for estimating the over/under-classification factor in attributing COVID-19 deaths as the underlying cause of death is to make the assumption that the ratio of COVID-19 deaths appearing in the multiple-cause of deaths fields of the death certificate by the COVID-19 deaths as underlying cause should be similar to the equivalent ratio for Influenza & Pneumonia. We can then adjust COVID-19 deaths to compensate for systematic under/over-estimation of COVID-19 deaths.
The formula for the adjustment factor, F, is simply:

Where R*J09-J18 refers to the ratio of death rates for Influenza & Pneumonia that was computed using the adjusted MC*J09-J18 death rates, which is the MC death rates from Influenza & Pneumonia except where COVID-19 is mentioned on the death certificate.
Consequently, by using the values shown in Figure 3 we estimate that the over-reporting factor for UC deaths from COVID-19 in 35 to 44 year-olds is 2.7 in 2020, 3.4 in 2021 and 2.5 in 2022. We can then divide the computed UC death rates from COVID-19 by the adjustment factor and obtain the death rate from COVID-19 that one would expect if the ratio of COVID-19 MC/UC ratio were similar to the equivalent ratio for Influenza & Pneumonia.
In this section we generalise the previous analysis for all age groups. We first compute the ratio of MC/UC deaths for both COVID-19 and Influenza & Pneumonia for each age group and then calculate the respective adjustment factors which are applied to the UC COVID-19 death rates for that age group.
We compute, for each age group, for 2020, 2021 and 2022, the ratio of R*J09-J18=MC*J09-J18/UCJ09-J18 death rates from Influenza & Pneumonia (J09-J18), and for COVID-19 (U07.1), (see Figure below). The ratio R*J09-J18=MC*J09-J18/UCJ09-J18 death rates for Influenza & Pneumonia was computed using the adjusted MC* death rates, which is the MC death rates from Influenza & Pneumonia except where COVID-19 is mentioned on the death certificate. For Influenza & Pneumonia, for comparison, we also plot the average ratio from 2015 to 2019.
When analysing the left Figure we can observe that the ratio of MC*/UC death rates from Influenza & Pneumonia in 2020 and 2022 are in line with the historical average for 2015 to 2019. In 2021 the ratio increases, particularly for younger individuals aged 45 or less. We can also observe that the ratio is particularly high for ages 5 to 54 ranging between about 3.5 and 4. The ratio is lower for individuals aged 75 or older, ranging between about 2.5 and 3.
In the right Figure we can observe that the ratio of MC/UC death rates for COVID-19 in 2020, 2021 and 2022 tend to follow a similar pattern where the ratio is higher for younger individuals and lower for older individuals. In 2020 and 2021 the ratio was close to 1.1 for ages 34 and higher, which means that almost all COVID-19-related deaths were classified as death from COVID-19 (it was the underlying cause of death). For 2022 we can notice that the ratio increased for all age groups, which can be explained by COVID-19 becoming milder over time. Yet, for ages 35 and above the ratio still ranged between 1.25 and 1.4 which means that COVID-19 was still mostly classified as the underlying cause of death. This was the case even for younger individuals where the ratio was always below 2.
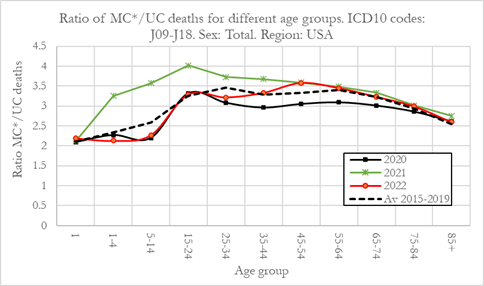
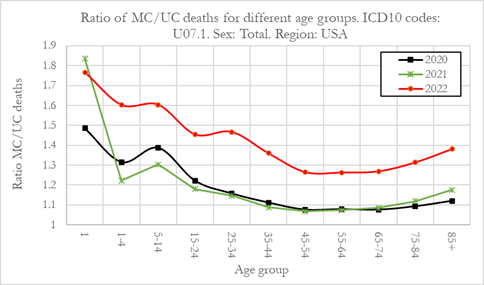
When computing the ratios, shown in Figure 4 for all ages, we estimate that for Influenza & Pneumonia, in 2020 the ratio was 2.84, in 2021 was 3.09 and 2022 it was 2.99. These values are equivalent to saying that the percentage of MC Influenza & Pneumonia reported as underlying cause of death was 35.2%, 32.3% and 33.5% for 2020, 2021 and 2022, respectively. For COVID-19, the equivalent ratio for all ages was 1.10 in 2020, 1.11 in 2021 and 1.32 in 2022, corresponding to a percentage of MC COVID-19 reports with COVID-19 as the underlying cause of death of 91.2%, 90.2% and 75.9% for 2020, 2021 and 2022, respectively.
We can notice that the ratio of MC/UC deaths for Influenza & Pneumonia was very stable with about 1/3 of these deaths being reported as the underlying cause. For COVID-19 however, around 90% of deaths were recorded as the underlying cause in 2020 and 2021, and a lower level of 75.9% in 2022. COVID-19 deaths as the underlying cause are over-reported when compared to Influenza & Pneumonia.
We now compute the adjustment factor for the over/under classification in attributing COVID-19 deaths as the underlying cause of death, using the formula shown in the equation above.
The Figure below shows the adjustment factor for 2020, 2021 and 2022, for the different age groups in the US. It can be observed that there is a systematic over-reporting of COVID-19 as the underlying cause of death compared to Influenza & Pneumonia. The average over-reporting factor is between 1.2 and 3.5 for all ages. However, one can notice that for ages 15 to 74 the over-reporting factor is higher than for younger and older individuals. For individuals aged 15 to 74 the over-reporting factor ranged from 2.3 to 3.5 between 2020 and 2022. For younger individuals aged 1-4 and 5-14, the over-reporting factor was low, with the exception of 2021.
For individuals with less than 1 year old, the over-reporting factor was consistent from 2020 to 2022 at around 1.3. The over-reporting factor is also lower for older individuals (aged 75 and over) ranging between 1.8 and 2.8.
The over-reporting factors for each age group in 2020, 2021 and 2022 can be found in Table 1, shown in Appendix 8.1 in the full paper.
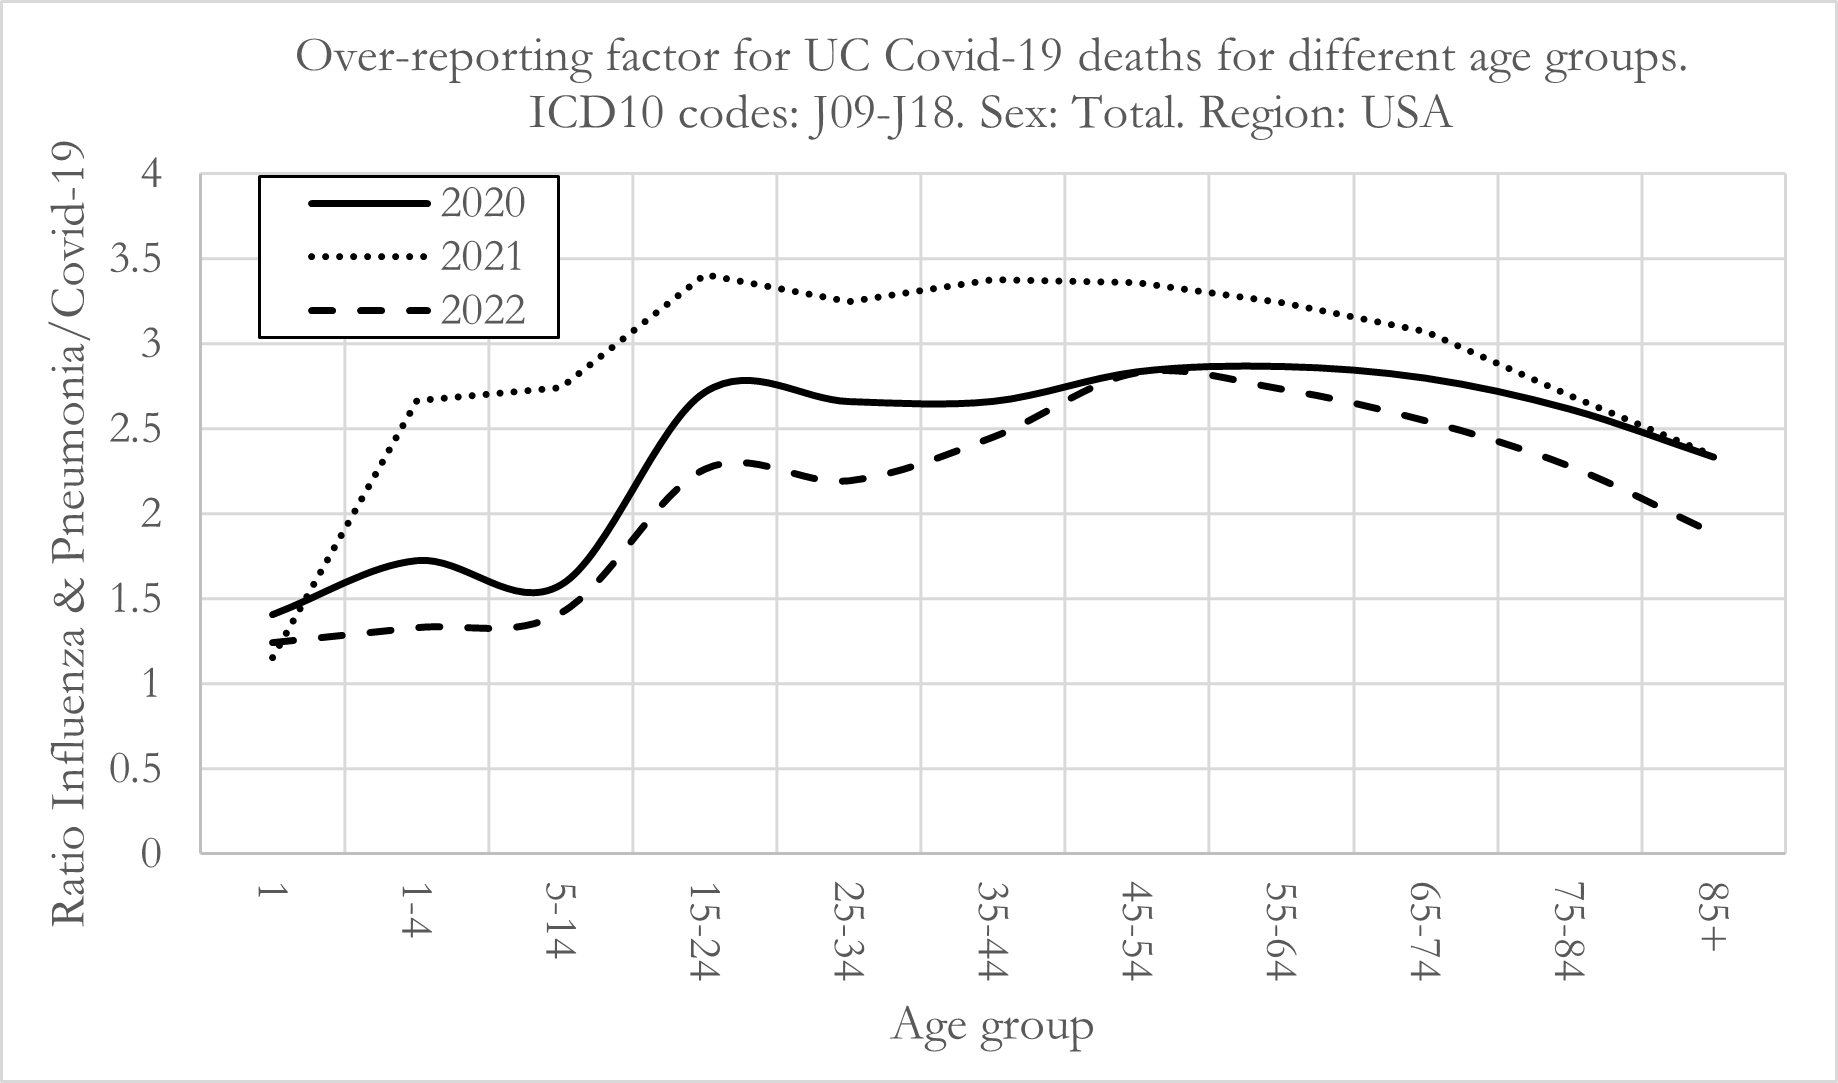
Overall, we also notice that there appears to be a systematic over-reporting of COVID-19 deaths as the underlying cause, which is consistent across all ages. To be clear, the adjustment factors above refer to the multiple by which COVID-19 underlying cause deaths are over-reported relative to Influenza & Pneumonia (J09-J18). An adjustment factor of 2 signifies that COVID-19 underlying cause deaths should be 50% of the reported values.
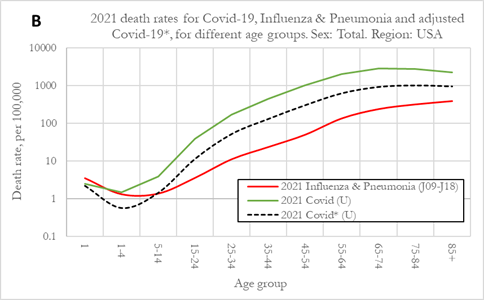
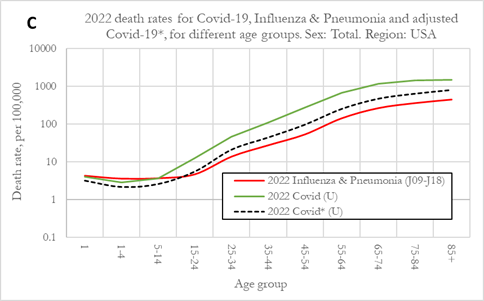
Once the over-reporting factors are computed, we now calculate the adjusted UC death rates from COVID-19* and compare them with the un-adjusted death rates from COVID-19 and death rates from Influenza & Pneumonia, as shown in Figure 6. All the death rates refer to the respective diseases as the underlying cause of death. Panel A shows the death rates for 2020, Panel B for 2021 and Panel C for 2022. The dashed lines refer to adjusted death rates for COVID-19*, where the adjustment is performed using the adjustment factors computed in the previous section 5.2. The full results for the death rates and adjustment factors can be found in Table 1, in Appendix 8.1 in the full paper.
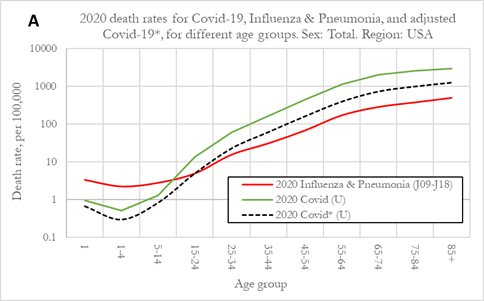
The results for 2020 (Figure A), show UC death rates from COVID-19 were higher than death rates for Influenza for age groups 15-24 and older. For younger individuals, death rates from COVID-19 were substantially lower than equivalent death rates from Influenza & Pneumonia. We also observe that death rates from COVID-19 for individuals 55 and older were roughly 10x the death rates Influenza & Pneumonia.
After the adjustment for over-reporting, UC COVID-19* death rates were still higher than those from Influenza & Pneumonia. For individuals aged 15-24 UC death rates from COVID-19* were similar to those for Influenza and Pneumonia and for age group 25-34 and older they were higher.
The results for 2021 (Figure B), show UC death rates from COVID-19 were generally higher than in 2020. Additionally, we observe that death rates from Influenza & Pneumonia were lower for age groups 1-4, 5-14 and 15-24 in 2021. We should note that in general, death rates from Influenza & Pneumonia were stable during 2020, 2021 and 2022 with the exception of the previously stated drop in death rates for younger individuals in 2021 and a rise in death rates for these same age groups in 2022.
Before applying the over-reporting adjustment factors, in 2021 COVID-19 death rates were higher than death rates from Influenza & Pneumonia for age groups older than 5-14. For the younger age groups under 1 and 1-4, death rates from Influenza & Pneumonia and COVID-19 were similar. After applying the adjustment factors for 2021, we can observe that UC COVID-19* death rates were much lower due to the higher over-reporting adjustment factors (Figure above). However, even after the adjustment, UC COVID-19* death rates were still much higher than death rates from Influenza & Pneumonia for age groups 15-24 and older, but lower for the younger age groups.
The results for 2022 (Figure C), show that UC death rates from COVID-19 dropped significantly but were still substantially higher than those for Influenza & Pneumonia. After adjusting for over-reporting using the adjustment factor, UC death rates from COVID-19* were of similar magnitude to those from Influenza & Pneumonia. For all age groups from 15-24 and older, UC death rates from COVID-19* were slightly higher than those from Influenza & Pneumonia, while for younger individuals aged 5-14 or less, they were slightly lower.
We also make the observation that UC death rates from COVID-19* for younger individuals aged 5-14 and lower were at their lowest in 2020, then rose in 2021 and in 2022 were at their highest level, which is strange to reconcile for our understanding that the different SARS-CoV-2 virus variants were successively milder (and more contagious) over time, with the milder Omicron variant being prevalent in 2022.
